Development Tools
Tracing
Jolt is instrumented using tokio-rs/tracing. These traces can be displayed using the --format chrome flag, for example:
cargo run -p jolt-core --release -- trace --name sha2-chain --format chrome
After tracing, files can be found in the workspace root with a name trace-<timestamp>.json. Load these traces into perfetto.
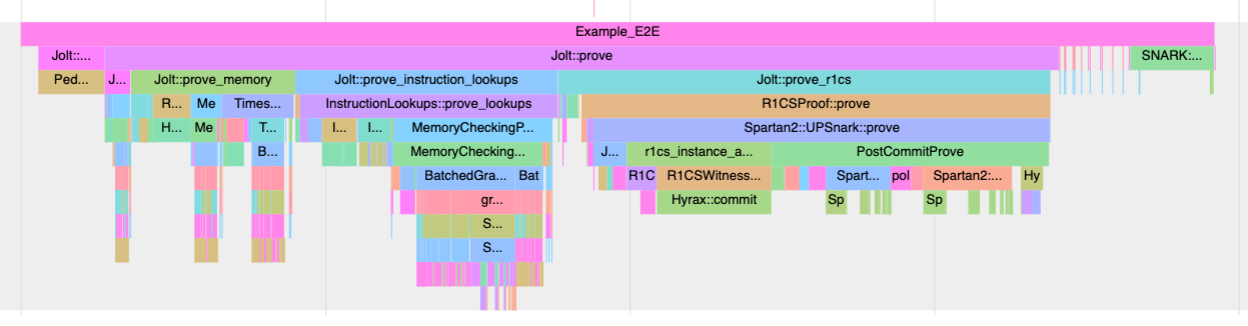
Often it's easiest to debug performance for a particular segment by adding granular tracing, adjusting code, rerunning the sha2-chain end-to-end benchmark and looking through the Chrome traces.
Objdump
Debugging the emulator / tracer can be hard. Use riscv64-unknown-elf-objdump to compare the actual ELF to the .bytecode / .jolttrace files.